
What changed when the requests started failing?
Search retained container logs and compare the first bad request with Docker health, restart, OOM, and resource events from the same window.
Tracebag runs on your Docker host for a debugging session. Search logs, inspect runtime counters, capture stacks and traces, then stop it when the work is done.
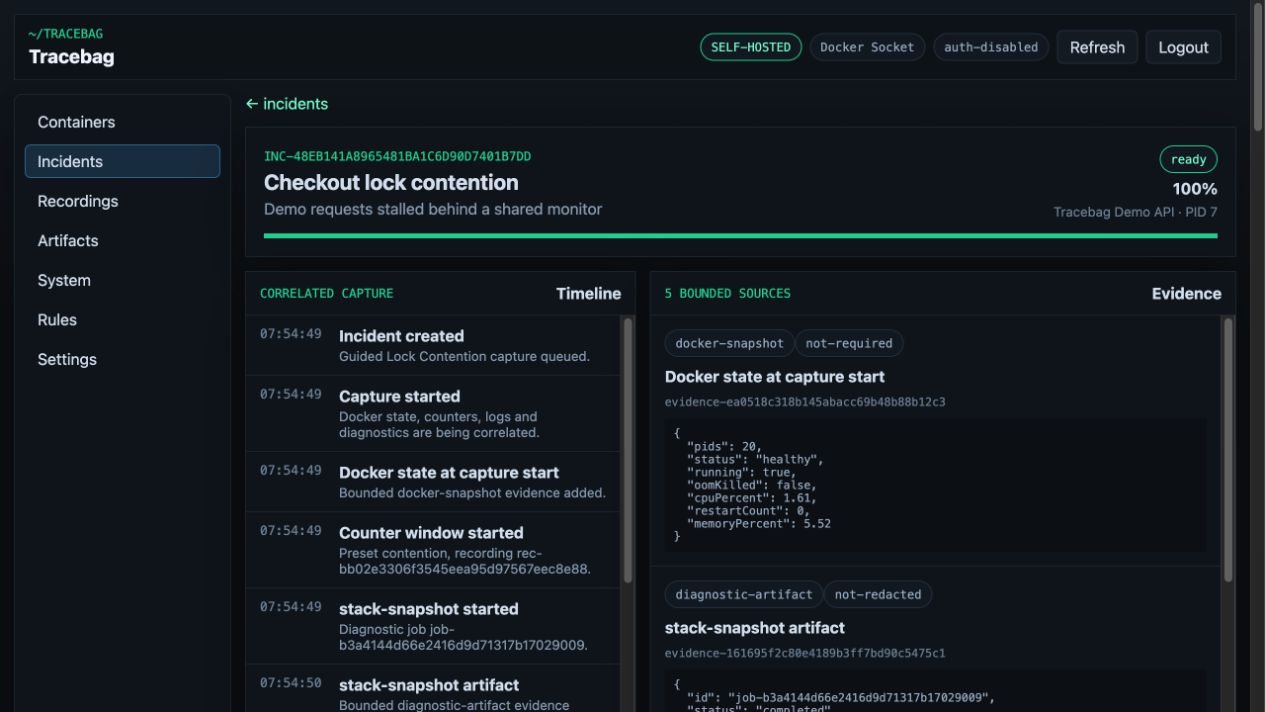
Tracebag is not a replacement for an observability stack. It is a browser interface for one difficult investigation and the evidence needed to explain it.
Search retained container logs and compare the first bad request with Docker health, restart, OOM, and resource events from the same window.
Watch or record CPU, allocation, GC, ThreadPool, contention, and memory counters without attaching an interactive shell to the workload.
Capture a bounded stack snapshot, EventPipe trace, or dump and keep it with the logs, notes, and exact time range that explain why it was taken.
The demo API can reproduce that exact situation with a bounded lock-contention workload. Tracebag records the counter window, captures stacks and a threading trace, and links the useful findings back to the original evidence.
Nothing in the demo is a mock screenshot or a scripted result. It runs the same images and diagnostic runners used for another opted-in .NET container.
Follow the ten-minute investigation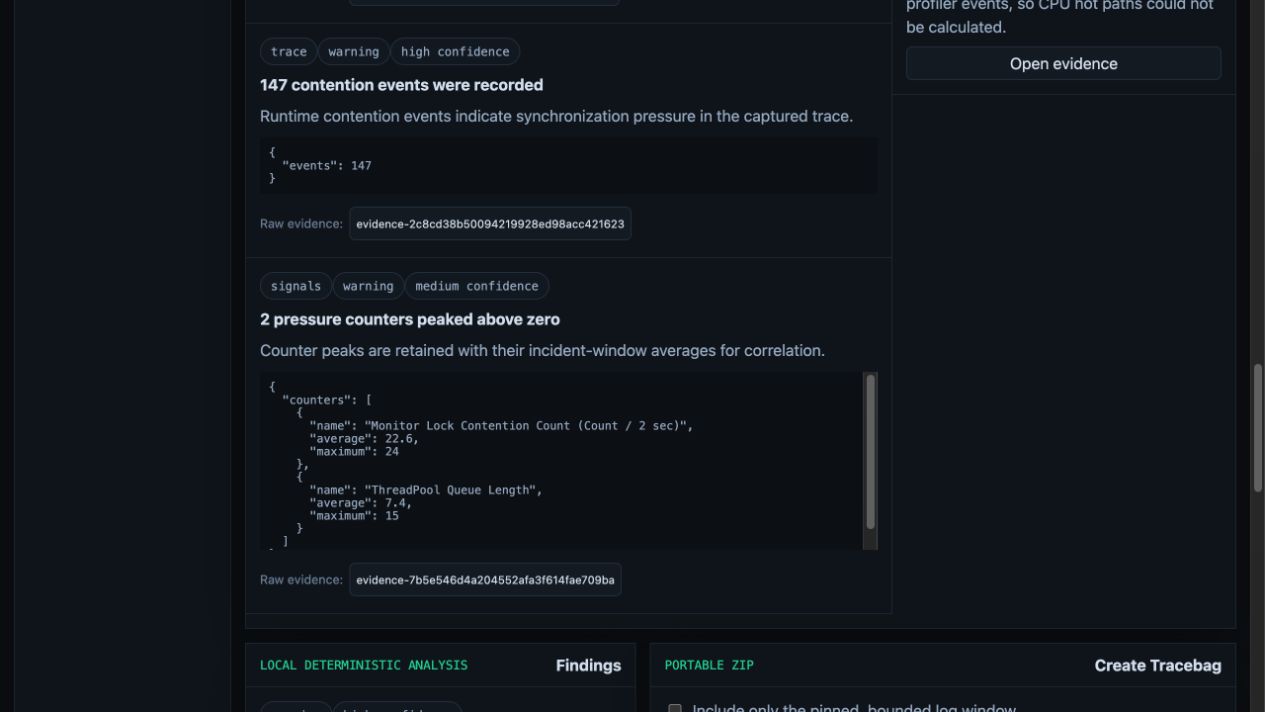
While Tracebag is running, its backend has Docker administrator capabilities. Use it only on a host you control, access it through localhost or a trusted HTTPS proxy, and stop it after the session.
Read the complete security modelGenerate CPU pressure, allocations, contention, slow requests, downstream failures, or ThreadPool starvation, then investigate the result in Tracebag.